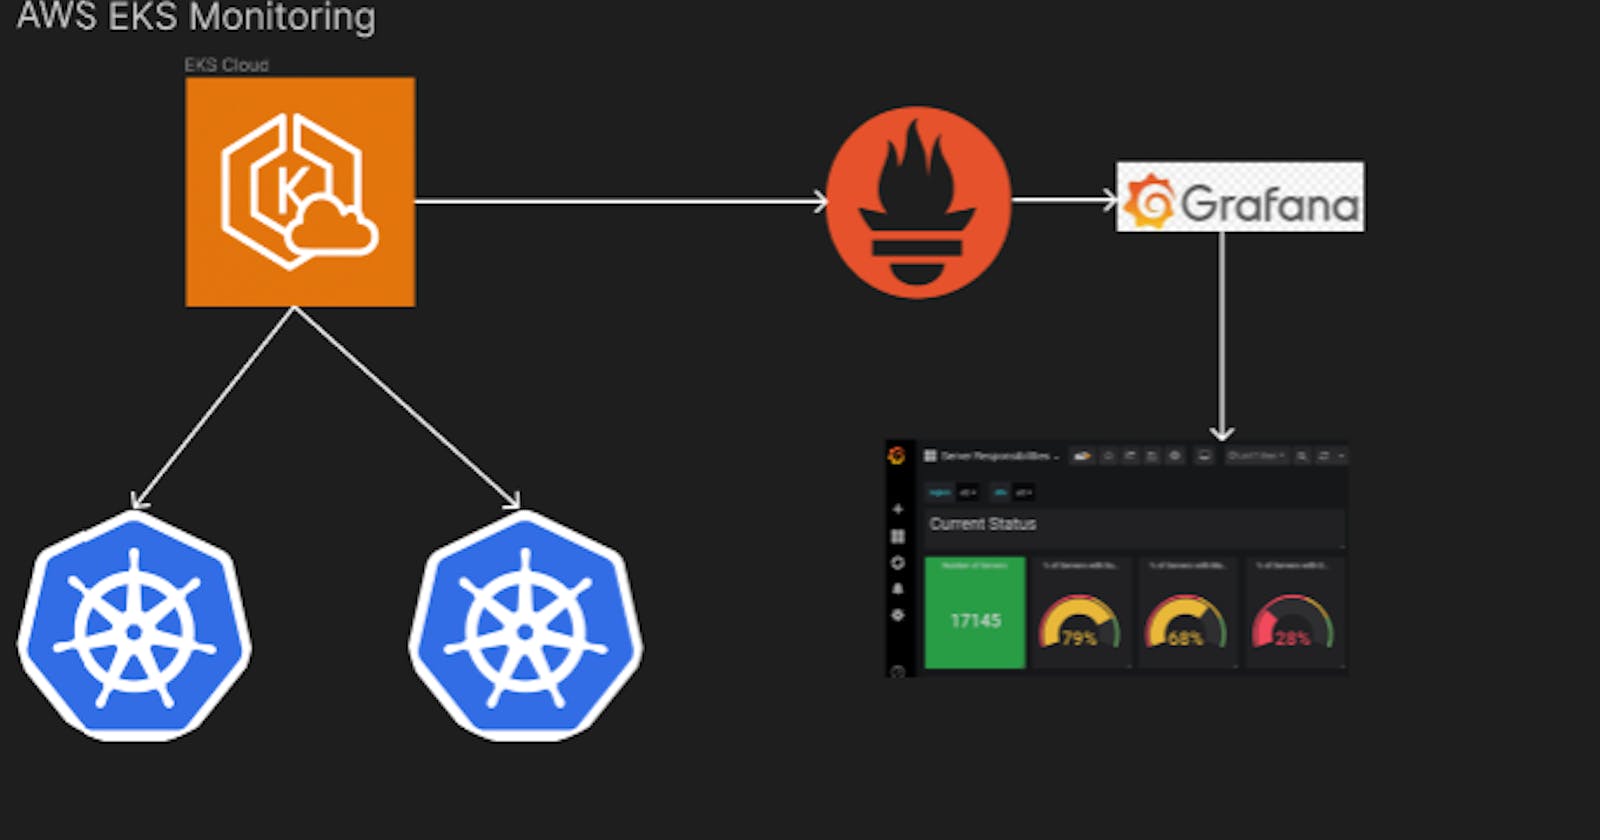
Monitoring the heartbeats of your applications becomes an art form when orchestrated with Prometheus and Grafana. In this enchanting guide, let's embark on a journey to infuse brilliance into your AWS EKS (Elastic Kubernetes Service) cluster by installing Prometheus and Grafana.
Prerequisites: Preparing the Canvas
AWS CLI and kubectl: Equip your palette with the AWS CLI and
kubectlon your local machine.eksctl: Craft your EKS cluster effortlessly by installing
eksctl. Find your magic wand here.
What is Prometheus?
Prometheus is an open-source systems monitoring and alerting toolkit originally built at SoundCloud. Prometheus collects and stores its metrics as time series data, i.e. metrics information is stored with the timestamp at which it was recorded, alongside optional key-value pairs called labels.
Architecture:
Prometheus scrapes metrics from instrumented jobs, either directly or via an intermediary push gateway for short-lived jobs. It stores all scraped samples locally and runs rules over this data to either aggregate and record new time series from existing data or generate alerts. Grafana or other API consumers can be used to visualize the collected data.

Prometheus Server:
The core component is responsible for collecting and storing time-series data.
Periodically scrapes metrics from configured targets (usually HTTP endpoints).
Stores data in a time-series database with a built-in retention period.
Scraping Targets:
Prometheus collects metrics from targets, which are endpoints exposing the metrics in a specific format (usually HTTP).
Common targets include applications, services, and infrastructure components.
PromQL (Prometheus Query Language):
A powerful query language for querying and processing time-series data.
Allows for aggregation, mathematical operations, and filtering based on metric labels.
Alerting Rules:
Defines conditions based on PromQL queries to trigger alerts.
Alerts can be sent to various integrations, such as Alertmanager or external notification systems.
Alertmanager:
Handles alerts sent by Prometheus.
Allows for deduplication, grouping, and routing of alerts to various receivers (e.g., email, Slack, PagerDuty).
Exporters:
Additional components that help Prometheus scrape metrics from systems that do not natively expose them in the required format.
Exporters act as bridges, translating metrics from various formats into the Prometheus format.
Grafana (Optional):
While not part of the Prometheus core, Grafana is often used alongside Prometheus for visualization and dashboarding.
Grafana queries Prometheus and displays metrics in a more user-friendly way.
Storage:
Prometheus has a built-in time-series database for storing scraped metrics.
The storage is designed to be efficient and provides compression and downsampling.
Service Discovery:
- Prometheus supports various service discovery mechanisms, such as Kubernetes service discovery, DNS-based discovery, or static configuration.
Grafana:
Grafana is an open-source data visualization and monitoring platform. It allows you to create visualizations of your data, including graphs, gauges, and maps, and to set up alerts based on certain thresholds. Grafana can connect to a variety of data sources, including Prometheus, and provides a way to build dashboards to monitor your systems and applications.
Together, Prometheus and Grafana can be used to monitor the performance and availability of your infrastructure and applications and to alert you when there are problems. They are widely used in production environments to ensure that systems are running smoothly and to identify and resolve issues quickly.
Create an EKS Cluster
Use eksctl to create an EKS cluster. Here I'm using the manifest file named clusterconfig.yml to create the cluster.
# spot-cluster.yaml
apiVersion: eksctl.io/v1alpha5
kind: ClusterConfig

metadata:
  name: translate
  region: us-east-1

nodeGroups:
  - name: ng-1
    instanceType: t4g.medium
    desiredCapacity: 2
    volumeSize: 20
    ssh:
      allow: true
To apply this simply run,
eksctl create cluster -f clusterconfig.yml
Create IAM OIDC Provider
This feature allows you to authenticate AWS API calls with supported identity providers and receive a valid OIDC JSON web token (JWT).
oidc_id=$(aws eks describe-cluster --name CLUSTER_NAME --query "cluster.identity.oidc.issuer" --output text | cut -d '/' -f 5)
aws iam list-open-id-connect-providers | grep $oidc_id | cut -d "/" -f4

eksctl utils associate-iam-oidc-provider --cluster CLUSTER_NAME --approve
Setup EBS CSI addon for EKS
Add IAM Role using eksctl
eksctl create iamserviceaccount \
  --name ebs-csi-controller-sa \
  --namespace kube-system \
  --cluster CLUSTER_NAME\
  --attach-policy-arn arn:aws:iam::aws:policy/service-role/AmazonEBSCSIDriverPolicy \
  --approve \
  --role-only \
  --role-name AmazonEKS_EBS_CSI_DriverRole
Then add EBS CSI to eks by running the following command:
eksctl create addon --name aws-ebs-csi-driver --cluster CLUSTER_NAME --service-account-role-arn arn:aws:iam::111122223333:role/AmazonEKS_EBS_CSI_DriverRole --force
Install helm
Helm is a package manager for Kubernetes, an open-source container orchestration platform. Helm helps you manage Kubernetes applications by making it easy to install, update, and delete them.
To install helm on EKS, run the following commands
sudo yum install openssl -y
curl https://raw.githubusercontent.com/helm/helm/master/scripts/get-helm-3 > get_helm.sh
chmod 700 get_helm.sh
./get_helm.sh
Once you install Helm on EKS then add Prometheus and Grafana repo by running the command
# add prometheus Helm repo
helm repo add prometheus-community https://prometheus-community.github.io/helm-charts

# add grafana Helm repo
helm repo add grafana https://grafana.github.io/helm-charts
Install Prometheus and grafana using helm
Install Helm by running the below command
kubectl create namespace prometheus

helm repo add prometheus-community https://prometheus-community.github.io/helm-charts

helm install prometheus prometheus-community/prometheus \
    --namespace prometheus \
    --set alertmanager.persistentVolume.storageClass="gp2" \
    --set server.persistentVolume.storageClass="gp2"
To check if the installation went well or not, please run this command
kubectl get all -n prometheus

If Prometheus installation went well then run this command to port forward and view this locally
kubectl port-forward -n prometheus deploy/prometheus-server 8080:9090
To install Grafana you need to add this yaml file first
mkdir ${HOME}/environment/grafana

cat << EoF > ${HOME}/environment/grafana/grafana.yaml
datasources:
  datasources.yaml:
    apiVersion: 1
    datasources:
    - name: Prometheus
      type: prometheus
      url: http://prometheus-server.prometheus.svc.cluster.local
      access: proxy
      isDefault: true
EoF
Then run this command to install Grafana
kubectl create namespace grafana

helm install grafana grafana/grafana \
    --namespace grafana \
    --set persistence.storageClassName="gp2" \
    --set persistence.enabled=true \
    --set adminPassword='EKS!sAWSome' \
    --values ${HOME}/environment/grafana/grafana.yaml \
    --set service.type=LoadBalancer
This command will create the Grafana service with an external load balancer to get the public view.
To get the external load balancer URL, run the following command
export ELB=$(kubectl get svc -n grafana grafana -o jsonpath='{.status.loadBalancer.ingress[0].hostname}')

echo "http://$ELB"
Conclusion
I hope this little exercise will help you understand the concepts of Kubernetes metrics monitoring using Prometheus and Grafana dashboards. Along with the monitoring Prometheus also supports alert management in case of reporting some critical failure in the system
